mcp-use, run the dev server and open the local Inspector:
| URL | Purpose |
|---|---|
http://localhost:3000/mcp | MCP endpoint |
http://localhost:3000/inspector | Inspector UI |
npx @mcp-use/inspector.
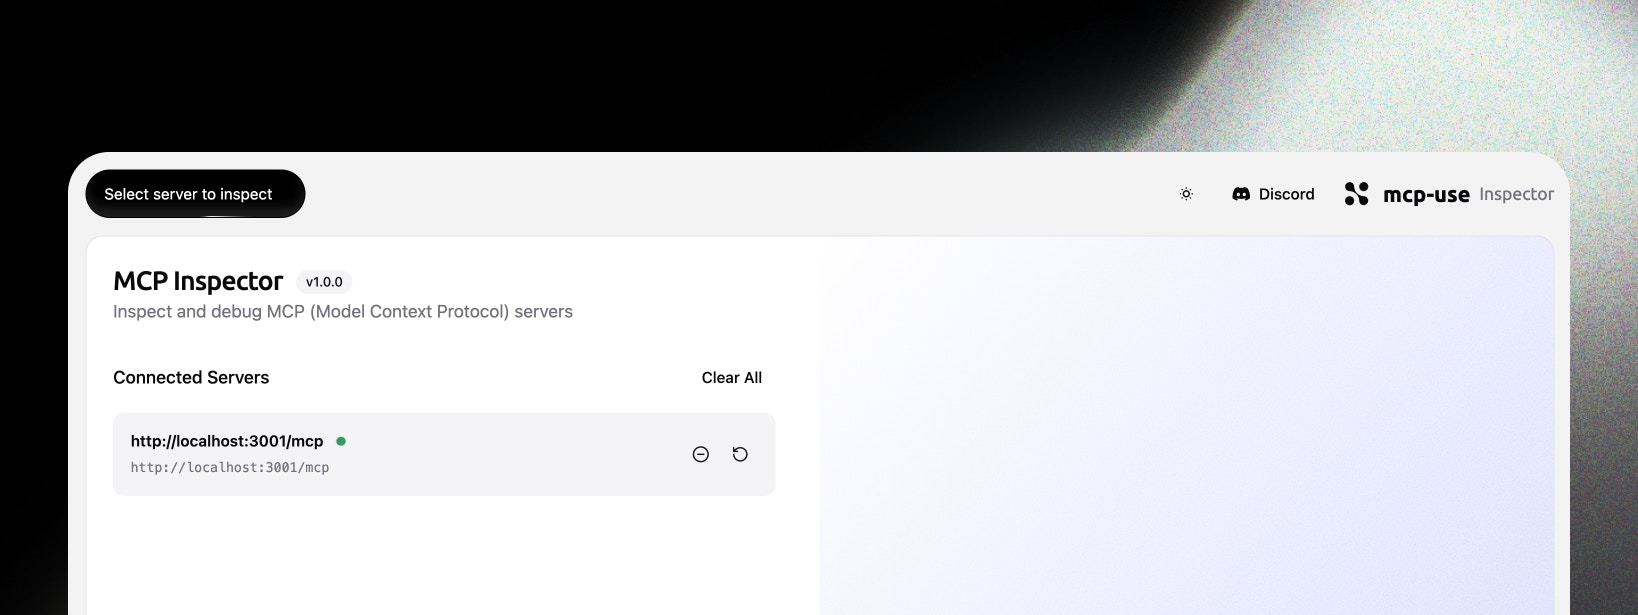
Connect to a server
Add a server from the dashboard. Choose the transport, enter the MCP endpoint URL, and click Connect.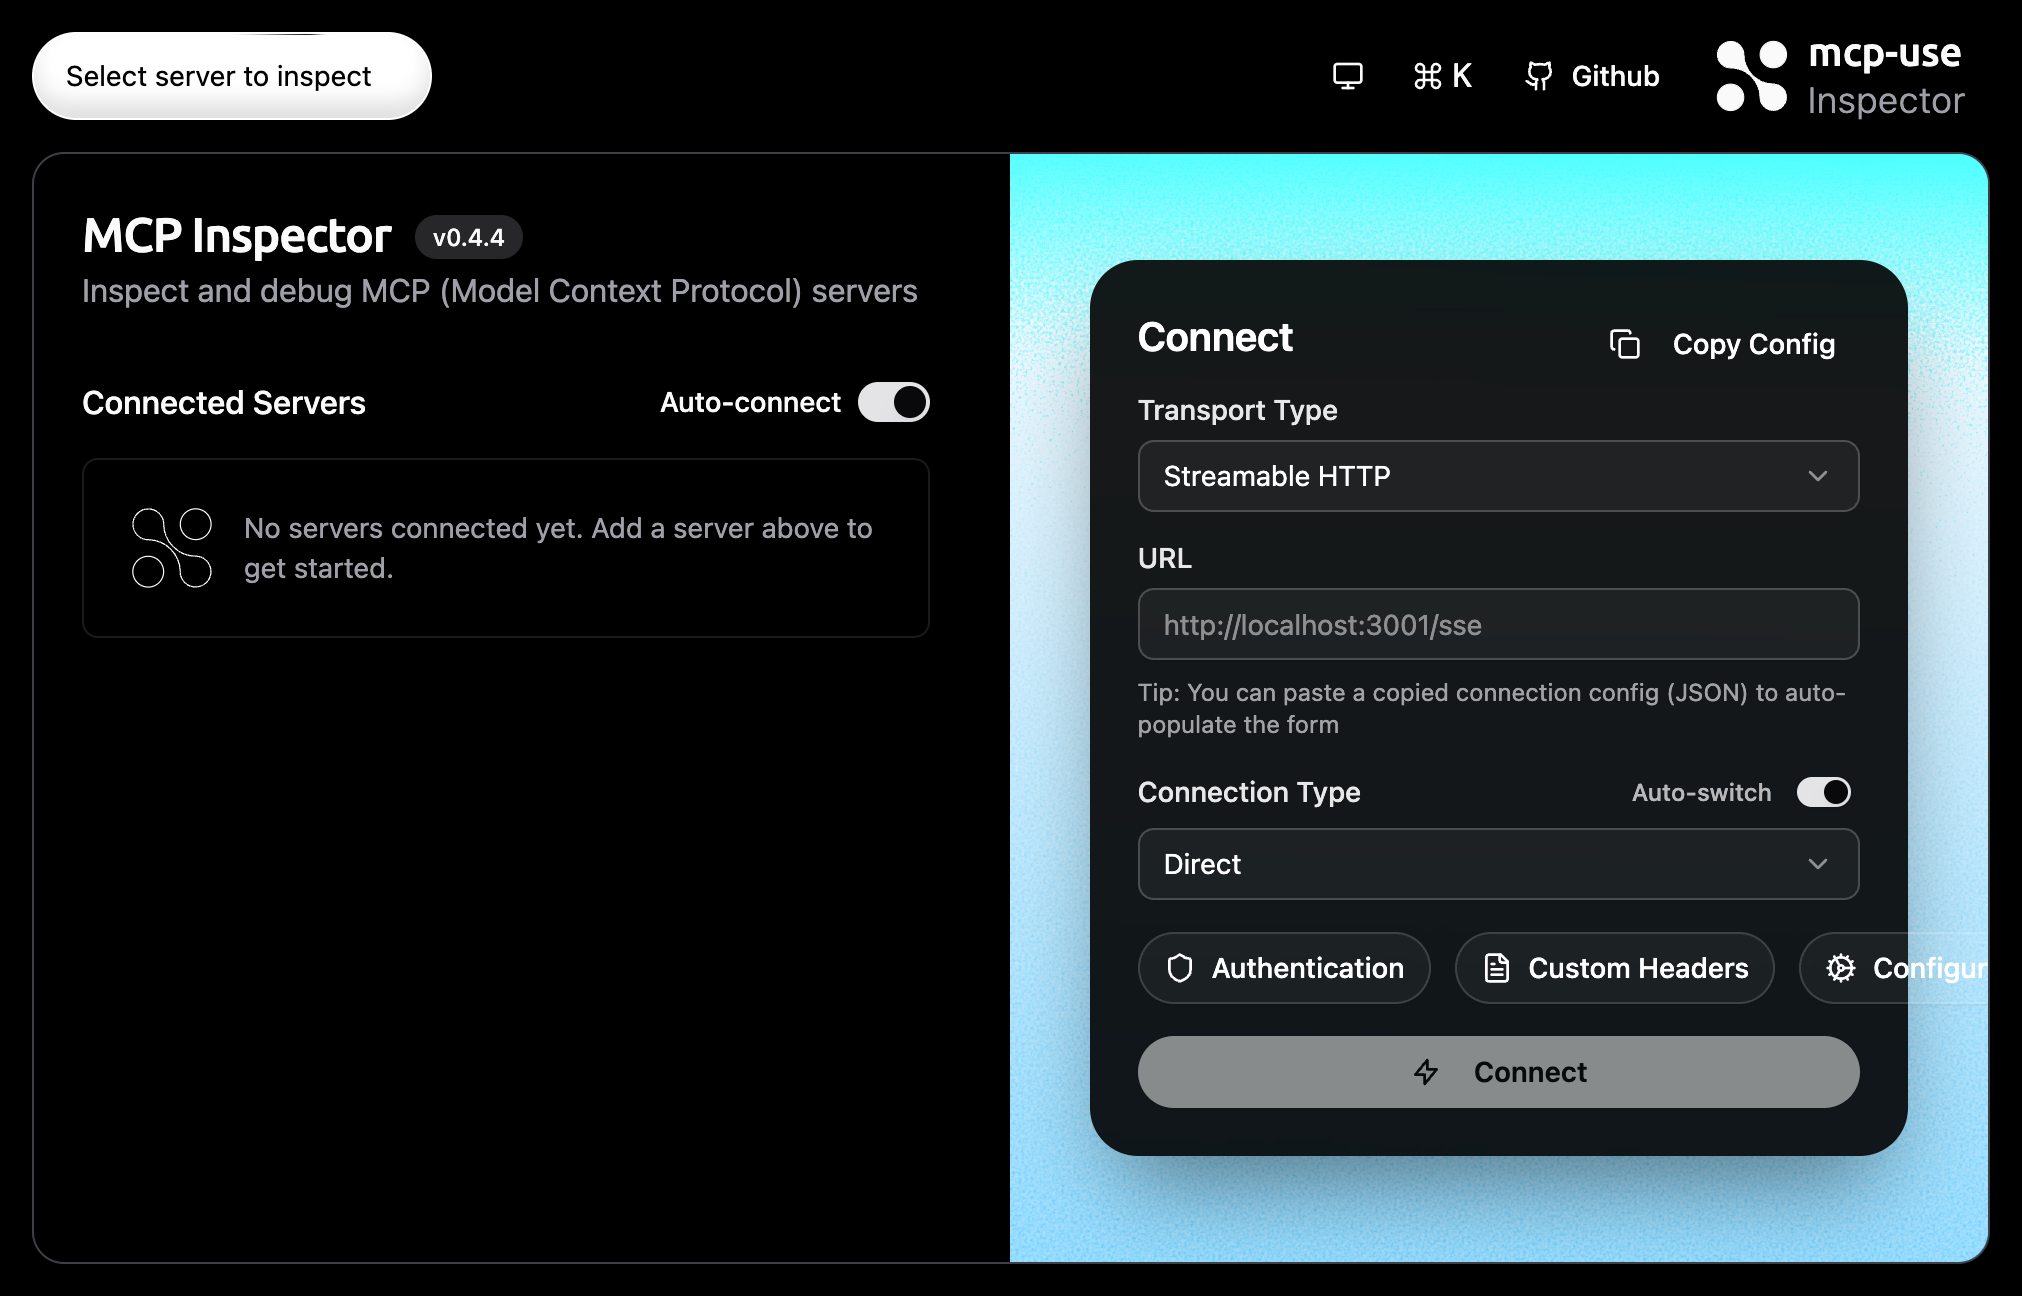
Run a tool
Open a connected server and select the Tools tab. Choose a tool, fill the generated form, and run it.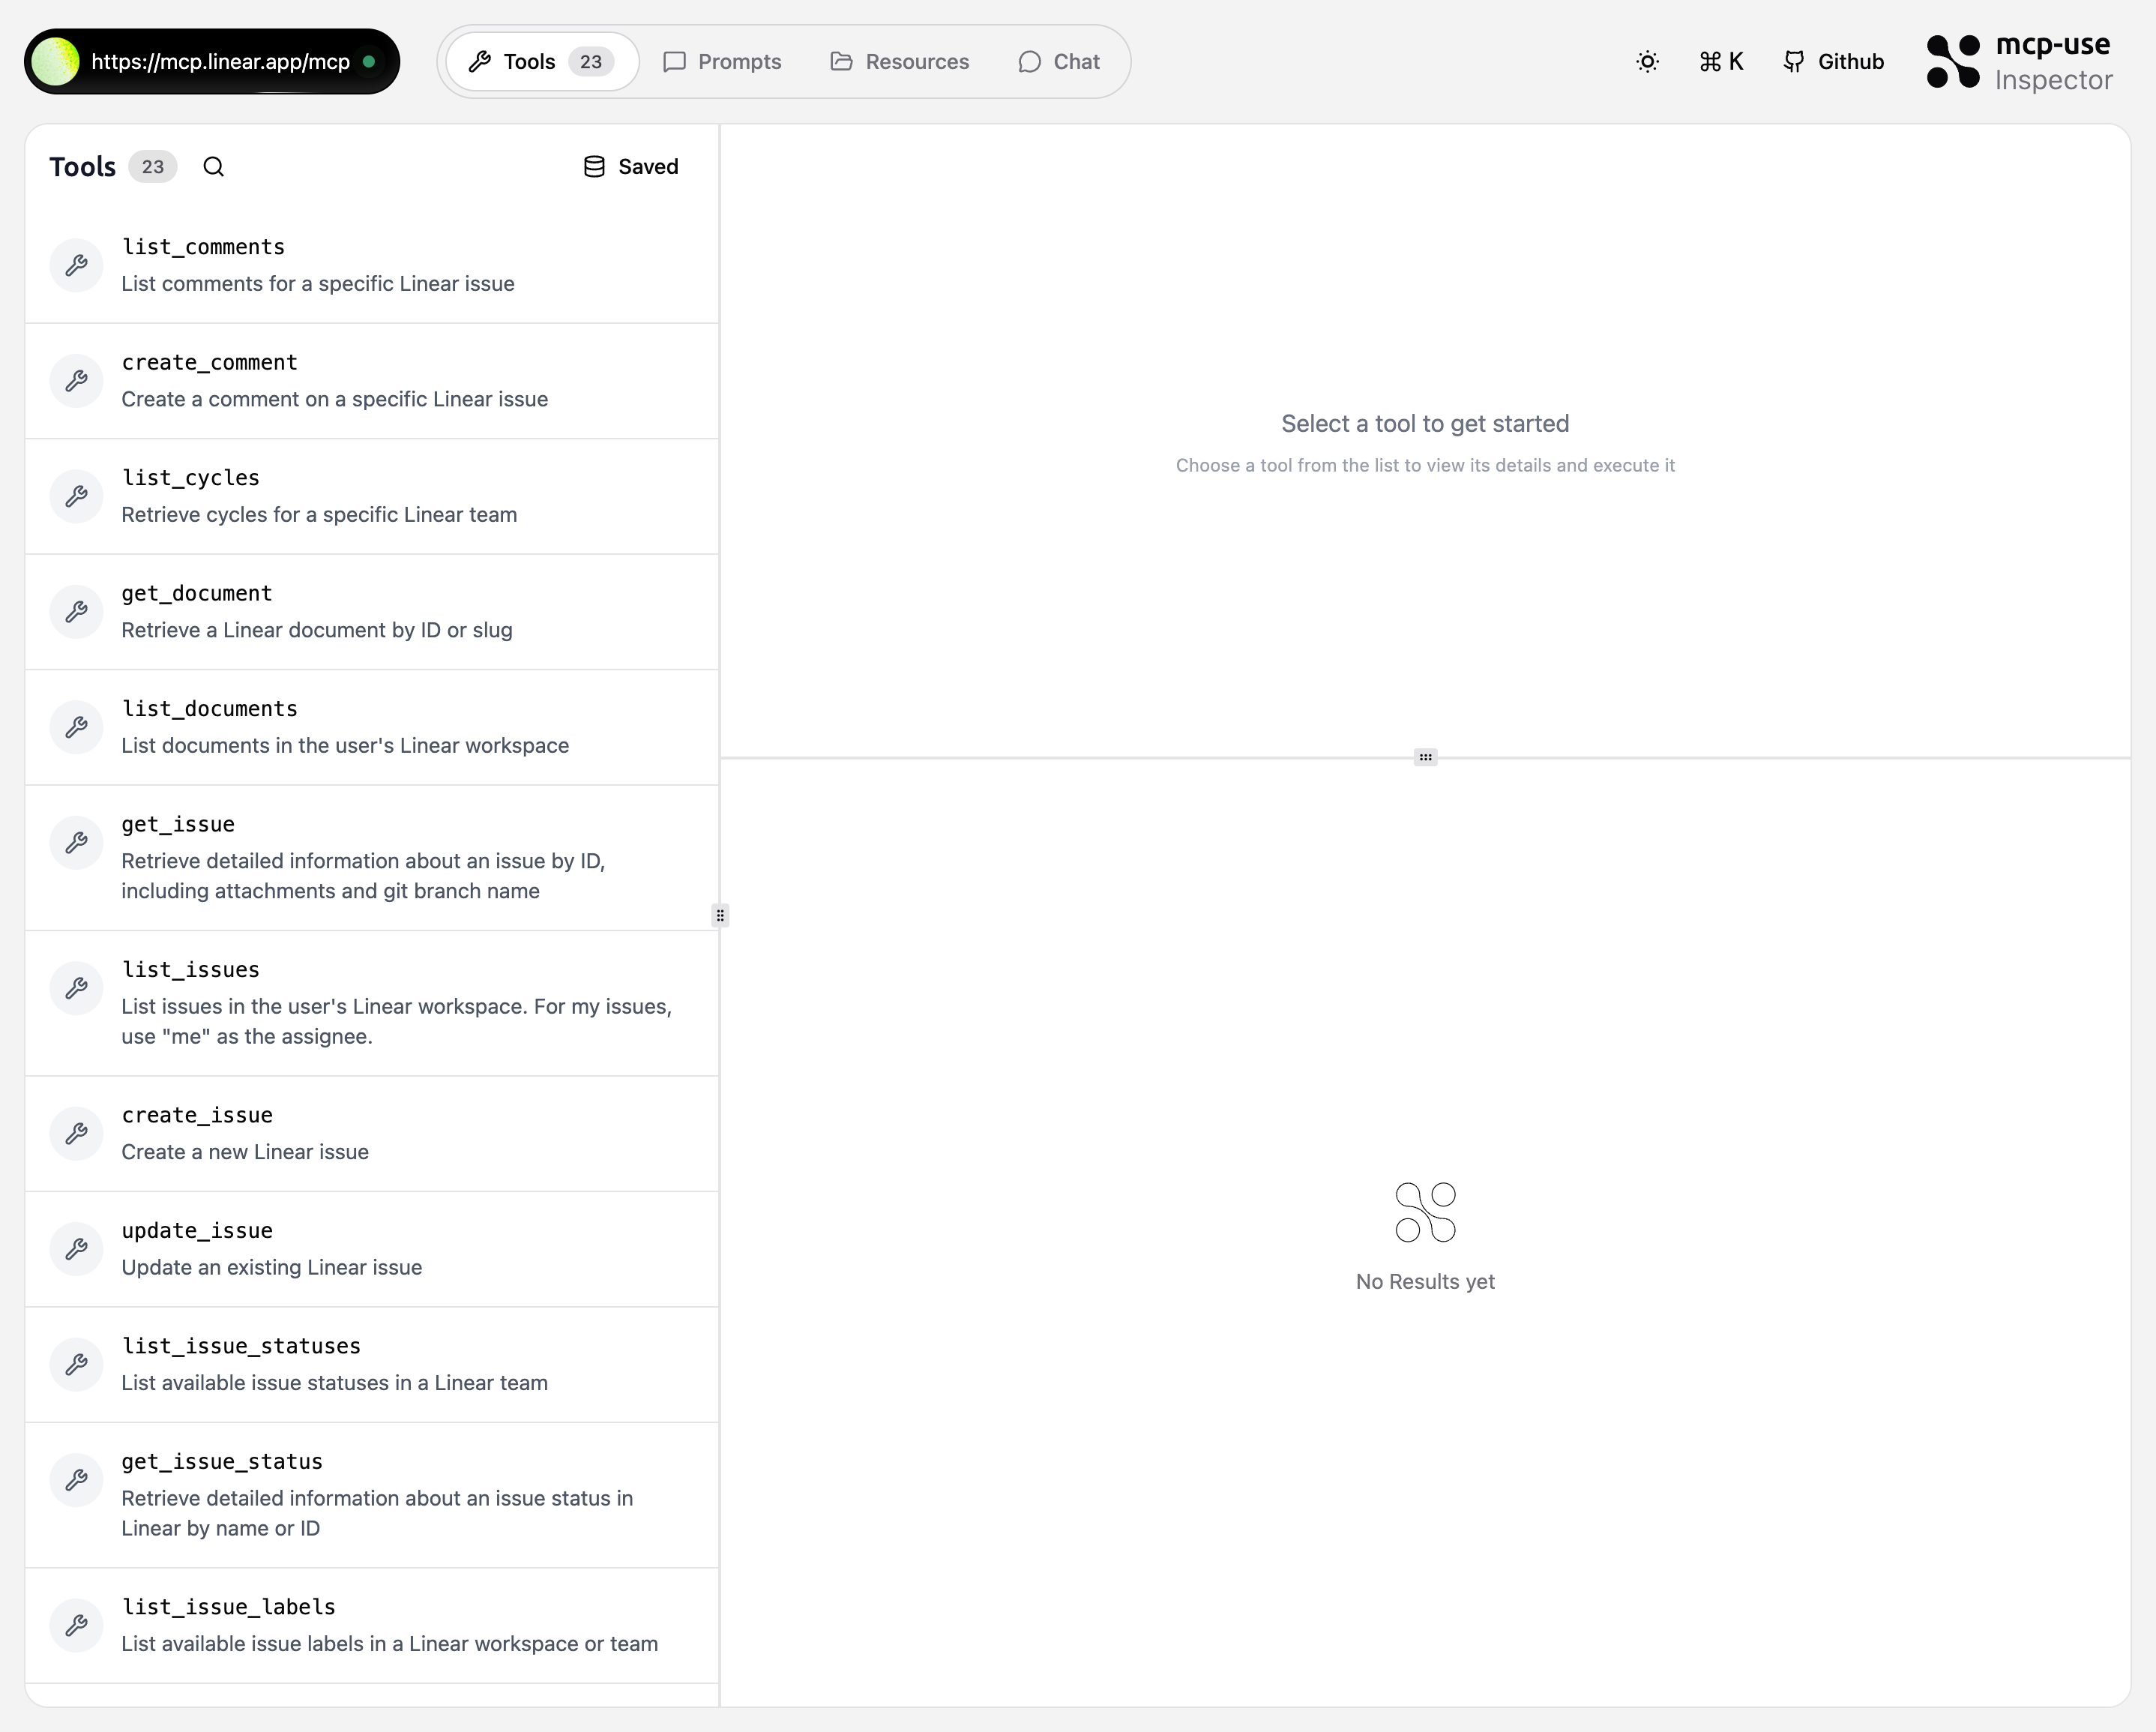
Inspect resources and prompts
Use Resources to read server-provided content by URI. Use Prompts to test reusable prompt templates with arguments. These tabs are useful when a client reports missing context. They show what the server actually exposes after connection and auth.Try chat
Use Chat to test how an LLM calls your server’s tools in a conversation. The chat view can use hosted chat where available or a provider key stored in your browser. Keep chat testing focused on end-to-end behavior. Use the Tools tab first when you need to isolate input schemas, tool errors, or widget rendering.Debug widgets
When a tool returns an MCP App widget, the Inspector renders it below the tool result and exposes widget debug controls. Use the widget view to check:- the
props,output, and metadata passed to the widget - inline, picture-in-picture, and fullscreen display modes
- desktop, tablet, and mobile layout behavior
- theme, locale, timezone, hover, touch, and safe-area settings
- Content Security Policy behavior before trying the widget in a host
Add the server to a client
After a server connects, use Add to Client to install or copy setup for supported clients such as Cursor, VS Code, Claude Desktop, Claude Code, Gemini CLI, and Codex CLI.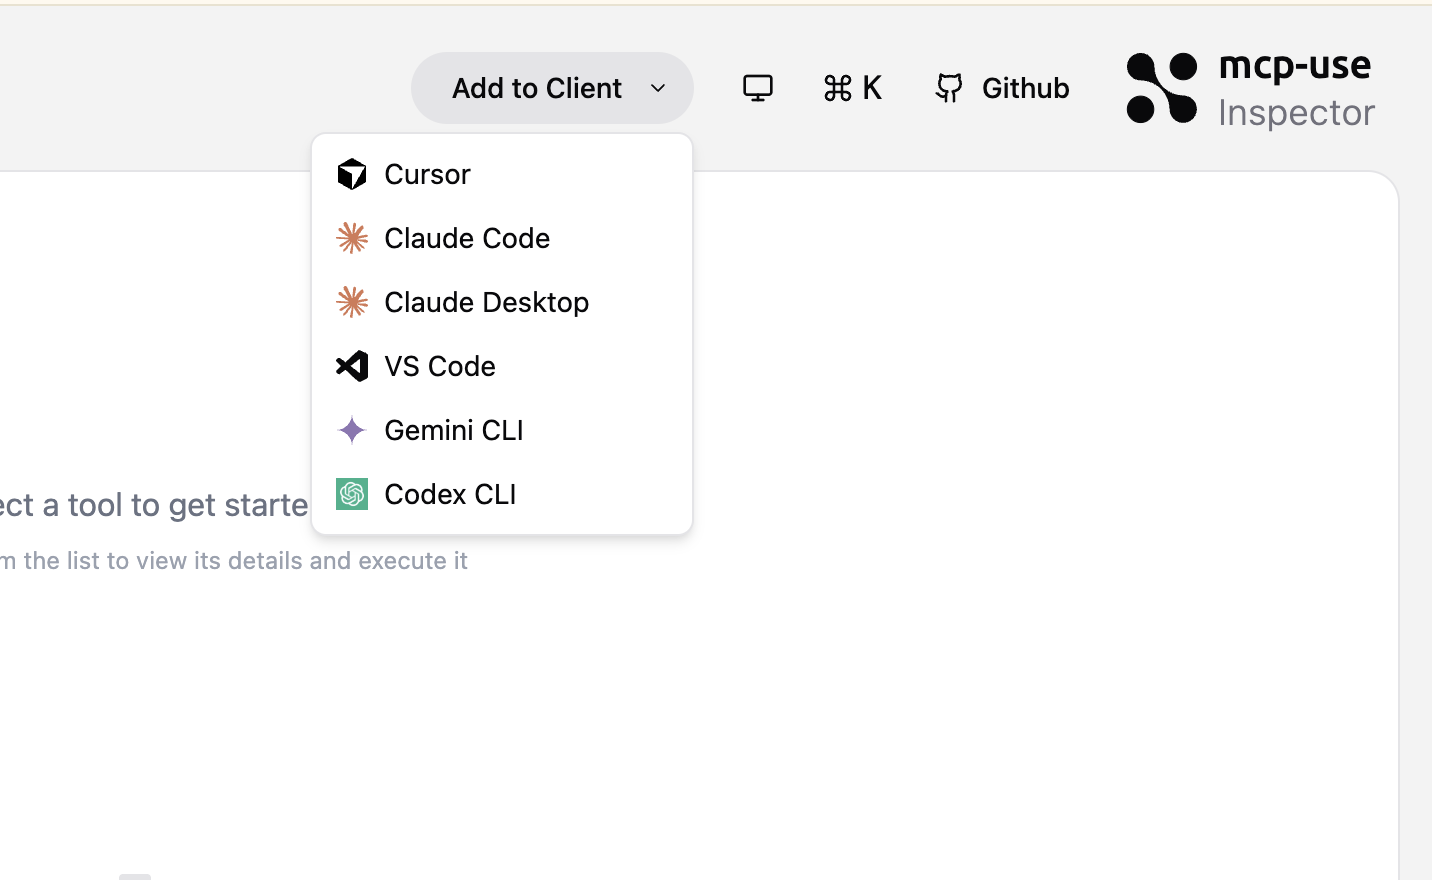
Command Palette
PressCmd/Ctrl + K to open the Command Palette. Use it to jump to tools, prompts, resources, saved requests, connected servers, and client setup actions.
For the full shortcut list, see Keyboard shortcuts. For shareable links that open a server or tab directly, see URL parameters.
Next steps
CLI usage
Run the Inspector from the command line and auto-connect to a server.
Connection settings
Choose Direct or Via Proxy and tune connection details only when needed.
Debug widgets
Test MCP Apps widgets, layout behavior, CSP, and display modes.
Mount the Inspector
Serve the Inspector from an Express, Hono, or mcp-use server.