

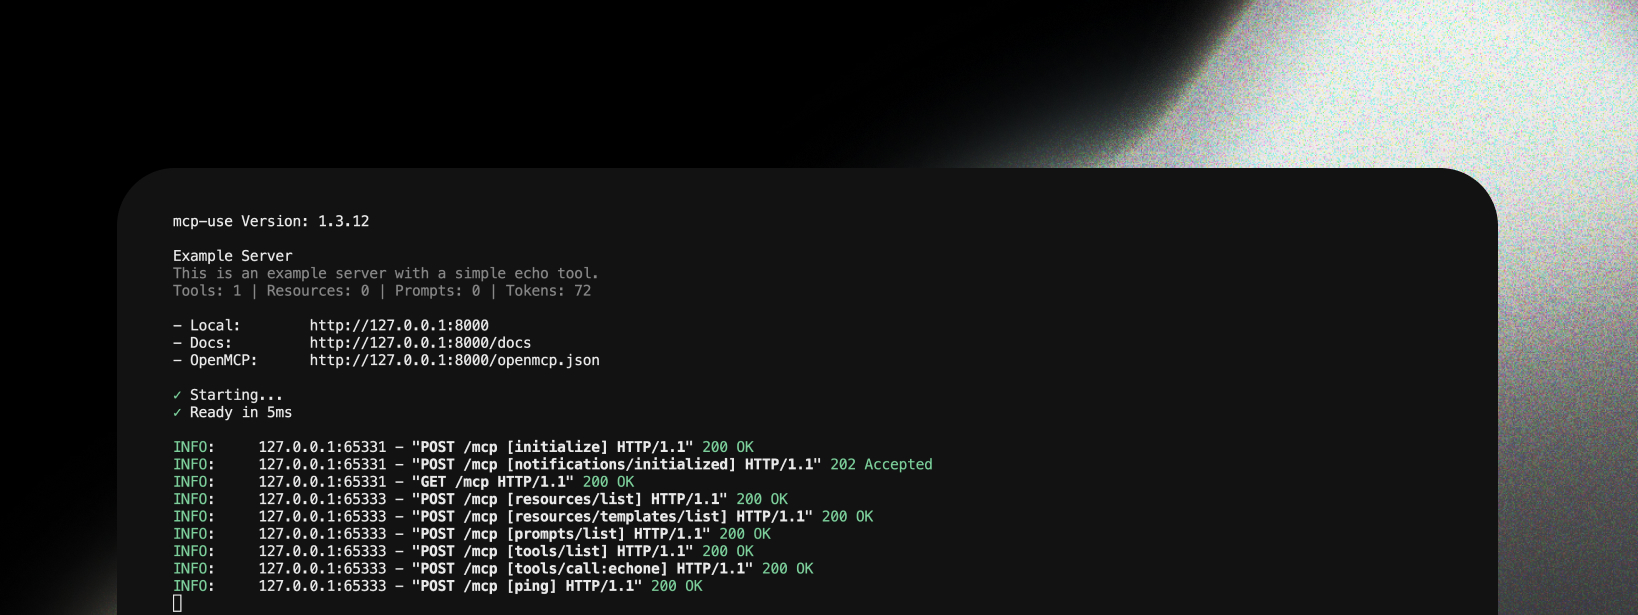
mcp-use provides clean, informative logging about MCP operations, making it easy to understand server activity and debug issues in both production and development.
MCP: prefix to differentiate them from regular HTTP logs.
Why Use MCP-Specific Logging?
This type of logging is essential because:- Clear visibility into which MCP methods are being called
- Easy debugging of MCP protocol interactions
- Request tracking with session IDs and method names
- Production monitoring of server usage patterns
- Error tracking for tools, resources, and prompts
- Performance insights with execution timing
Log Levels
mcp-use provides three logging modes controlled by thedebug parameter and DEBUG environment variable:
Production Logs (Default: debug=False)
Clean, readable logs showing MCP method calls with the MCP: prefix:
Debug Logs (debug=True)
Same logs as production + development routes (inspector, docs). By default, inspector logs are hidden:
Full Debug Logs (DEBUG=2 environment variable)
Same logs as debug mode + JSON-RPC request/response logging:
Pretty Print Mode (pretty_print_jsonrpc=True)
For easier debugging, enable pretty-printed JSON-RPC logs with Rich panels:
Understanding the Log Format
Each MCP log line contains detailed information about the request:1
Log Prefix
MCP: - Identifies this as an MCP-specific log (distinct from regular HTTP INFO: logs)2
Client Address
127.0.0.1:58478 - The IP address and port of the client making the request3
HTTP Method
POST - The HTTP method used for the request4
Endpoint
/mcp - The MCP server endpoint path5
MCP Method
[tools/call:search] - The specific MCP method being called (e.g., tools/call, resources/list, etc.)6
HTTP Version
HTTP/1.1 - The HTTP protocol version7
Status Code
200 - The HTTP response status codeCommon MCP Methods
The logs clearly show which MCP methods are being called, such as:[initialize]- Server initialization[tools/list]- Listing available tools[tools/call:search]- Calling a specific tool[resources/list]- Listing available resources[resources/read:config]- Reading a specific resource[prompts/get:assistant]- Getting a specific prompt
Configuration
Logging is automatically configured based on theDEBUG environment variable:
Logging Options
Inspector Logs (show_inspector_logs)
By default, inspector-related logs (requests to /inspector/*) are hidden to keep the output clean. Enable them if needed:
show_inspector_logs=False (default):
show_inspector_logs=True:
MCP Logs Only (mcp_logs_only)
By default, the server shows both MCP: protocol logs and INFO: HTTP access logs. Enable mcp_logs_only to suppress all HTTP access logs and only show MCP protocol traffic:
mcp_logs_only=False (default):
mcp_logs_only=True:
INFO: lines for MCP requests and hides non-MCP HTTP traffic (/docs, /inspector, static files), giving you a clean view of only MCP protocol activity.
Pretty Print JSON-RPC (pretty_print_jsonrpc)
Enable pretty printing to display JSON-RPC requests and responses as formatted Rich panels:
pretty_print_jsonrpc=False (default):
pretty_print_jsonrpc=True:
Combined Example
Client Log Messages (MCP Protocol)
In addition to server-side logging, MCP servers can send structured log messages to clients using the MCP logging protocol. This lets clients display or process server activity in their UI.Sending Log Messages
Usectx.log() or the convenience methods inside tool handlers:
Log Levels
Log levels follow RFC 5424 syslog severity, from lowest to highest:Client-Controlled Filtering
Clients can set a minimum log level vialogging/setLevel. When a client sets the level to warning, the server automatically suppresses debug, info, and notice messages - only warning and above are sent:
ctx.log() at the appropriate level and the server handles the rest.
Next Steps
- Inspector UI - Monitor logs in real-time
- Running the Server - How to run your server